Mohr's Circle
Mohr's circle, named after Christian Otto Mohr, is a two-dimensional graphical representation of the state of stress at a point. The abscissa, Ơn, and ordinate, Ƭn, of each point on the circle are the normal stress and shear stress components, respectively, acting on a particular cut plane with a unit vector n with components (n1,n2,n3) . In other words, the circumference of the circle is the locus of points that represent the state of stress on individual planes at all their orientations.
Mohr's circle for two-dimensional stress states
Given an initial stress element, or the stress values σx, σy, and τxy, Mohr’s circle can be constructed. The following sign conventions hold:
1. Tensile stresses (positive) are to the right.
2. Compressive stresses (negative) are to the left.
3. Clockwise shear stresses are plotted upward.
4. Counterclockwise shear stresses are plotted downward.
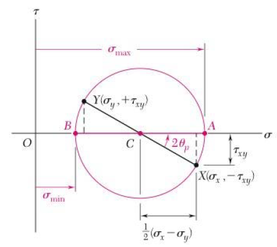
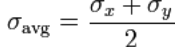
In order to draw Mohr’s circle on a Cartesian coordinate system, the x-axis and y-axis are identified as the σ-axis and τ-axis, respectively. The first two points of the circle to plot are point 1 (σx, τxy) and point 2 (σy, -τxy). The line connecting these two points is the diameter of the circle, knowing this, the circle can now be drawn. The center of the circle is located where the diameter intersects the σ-axis, it is also the average normal stress (σavg). The average normal stress can be read from the coordinate system if it was drawn to scale or it can be calculated using the formula
1. Tensile stresses (positive) are to the right.
2. Compressive stresses (negative) are to the left.
3. Clockwise shear stresses are plotted upward.
4. Counterclockwise shear stresses are plotted downward.
In order to draw Mohr’s circle on a Cartesian coordinate system, the x-axis and y-axis are identified as the σ-axis and τ-axis, respectively. The first two points of the circle to plot are point 1 (σx, τxy) and point 2 (σy, -τxy). The line connecting these two points is the diameter of the circle, knowing this, the circle can now be drawn. The center of the circle is located where the diameter intersects the σ-axis, it is also the average normal stress (σavg). The average normal stress can be read from the coordinate system if it was drawn to scale or it can be calculated using the formula
The line from the center of the circle that passes through point 1 will represent the x-axis, this will be used later to relate the direction of the Mohr’s circle stresses to the normal x and y directions.
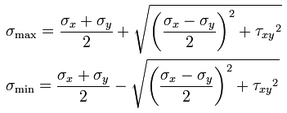
The two end points of the horizontal diameter are σ1and σ2. The point σ1 represents the maximum normal stress (σmax) and the point σ2 is the minimum normal stress (σmin). The equations for finding these values are
The two end points of the horizontal diameter are σ1and σ2. The point σ1 represents the maximum normal stress (σmax) and the point σ2 is the minimum normal stress (σmin). The equations for finding these values are
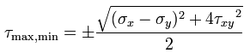
The vertical diameter passes through Ơavg and goes up to positive Ƭmax and down to negative Ƭmin. The equation to find the value of Ƭmax,min is
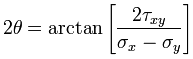
The next value to determine is the angle that the normal stress is acting at. This is the angle between the positive σ-axis and the x-axis. The measure of the angle is found by:
To find the angle that the maximum stress is acting at the following equation is used
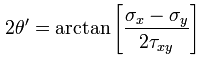
It is important to pay attention to the use of these two equations as they look similar.
The last thing to do is to draw the initial stress element as if it was not given, the normal stress element at an angle θ, and the maximum shear stress element at an angle of θ'.
The last thing to do is to draw the initial stress element as if it was not given, the normal stress element at an angle θ, and the maximum shear stress element at an angle of θ'.
